
Ethereum has moved back into a valuation band that on-chain analysts often treat as a deep-value zone, with long-term MVRV readings still negative in early March 2026 even as ETH trades near the low-$2,000s. The setup matters because similar periods in prior cycles were followed by outsized rebounds, though the signal is not a timing tool on its own. Data from Santiment, Farside Investors, CoinGlass, and broader market trackers show a market where spot demand, ETF flows, and derivatives positioning are pulling in different directions as of March 2026.
📊
Key finding:
Santiment reported Ethereum’s 365-day MVRV at -28.5% in the first week of March 2026, while the 30-day MVRV had reset to around neutral after briefly reaching +5.6%. That combination points to weak short-term profit pressure but continued long-term undervaluation, based on Santiment’s March 2026 market summary.
Ethereum Snapshot: Valuation, Flows, and Positioning
| Metric | Reading | Context |
|---|---|---|
| 365-day MVRV | -28.5% | Long-term holders remain underwater on average |
| 30-day MVRV | ~0% after +5.6% | Short-term profit-taking pressure has cooled |
| US spot ETH ETF cumulative net flow | $11.62B | Positive since launch despite daily volatility |
| US spot ETH ETF flow on March 10, 2026 | +$12.6M | Followed a -$51.3M day on March 9 |
| ETH futures data availability | Open interest and funding monitored across venues | Derivatives remain a major driver of short-term price action |
Source: Santiment and Farside Investors | March 2026 snapshots; CoinGlass futures market page crawled March 2026
365-day MVRV at -28.5% revives a cycle-level Ethereum signal
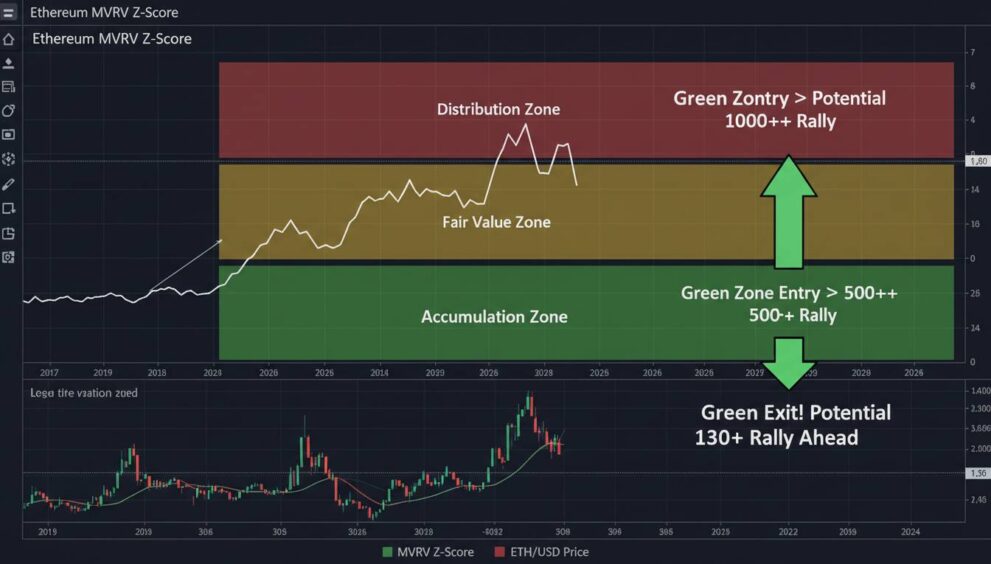
MVRV, or market value to realized value, compares Ethereum’s market capitalization with the aggregate on-chain cost basis of coins last moved on the network. In practical terms, it measures whether holders are sitting on large unrealized profits or losses. When the ratio drops deeply negative on longer time frames, it suggests the market price has fallen below the average cost basis of many holders, a condition often associated with capitulation or late-stage corrections. Glassnode describes MVRV as a gauge of unrealized profit and loss, while Santiment’s March 2026 readout places Ethereum’s 365-day version at -28.5%.
The “130%+ rally” framing comes from historical pattern matching rather than a guaranteed forecast. In prior Ethereum cycles, deep undervaluation zones were followed by strong rebounds once macro liquidity, risk appetite, and network demand improved. That said, the exact return profile varied by cycle, and the signal worked best when paired with improving spot demand and reduced forced selling. Santiment’s data show the short-term 30-day MVRV briefly rose to +5.6% during a rally before resetting to neutral, which means the market has already flushed some near-term profit-taking without fully repairing the longer-term drawdown.
Ethereum MVRV and Flow Timeline
February 10, 2026: KuCoin’s market note said Ethereum had entered a capitulation-style zone as MVRV turned negative, after ETH fell toward the high-$1,800s.
March 4, 2026: US spot ETH ETFs recorded a combined +$169.4 million daily inflow, one of the stronger March sessions in Farside’s table.
March 9, 2026: US spot ETH ETFs posted -$51.3 million in net outflows.
March 10, 2026: Net flows turned positive again at +$12.6 million.
First week of March 2026: Santiment reported 365-day MVRV at -28.5% and 30-day MVRV near 0%.
What is driving ETH’s undervaluation signal in March 2026?
Three forces stand out. First, Ethereum has not fully recovered from the sharp drawdown that hit crypto markets in early 2026. Market summaries from February and March show ETH trading around the low-$2,000 range after a steep selloff from late-2025 levels, leaving many one-year holders at a loss. That is the direct mechanical reason the 365-day MVRV remains negative.
Second, ETF demand has been positive in aggregate but uneven day to day. Farside Investors’ running table shows cumulative net inflows of about $11.62 billion for US spot Ethereum ETFs, a large figure relative to the product set’s age. But the same table also shows sharp daily swings, including a $169.4 million inflow on March 4, a $90.9 million outflow on March 5, an $82.9 million outflow on March 6, and a $51.3 million outflow on March 9 before a modest rebound on March 10. That pattern suggests institutional access exists, but conviction is not linear.
Third, derivatives still matter. CoinGlass’ ETH futures market page tracks funding rates, 24-hour volume, open interest, long-short ratios, and liquidations across exchanges, underscoring how leveraged positioning can amplify short-term moves even when on-chain valuation looks attractive. Historical CoinGlass reporting has shown that elevated open interest can coexist with weak spot price performance, which means an undervaluation signal can persist longer than traders expect if leverage remains crowded or macro conditions tighten.
US Spot Ethereum ETF Flow Swings in March 2026
| Date | Net Flow | Interpretation |
|---|---|---|
| March 4, 2026 | +$169.4M | Strong institutional demand day |
| March 5, 2026 | -$90.9M | Heavy reversal after inflow spike |
| March 6, 2026 | -$82.9M | Second straight large outflow |
| March 9, 2026 | -$51.3M | Risk appetite remained fragile |
| March 10, 2026 | +$12.6M | Flows turned positive again |
Source: Farside Investors | ETH ETF flow table, accessed March 2026
Ethereum versus prior MVRV resets: why the setup is notable
The significance of a negative long-term MVRV reading is historical, not absolute. In earlier cycle resets, Ethereum tended to bottom when long-duration holders were under water, speculative excess had been reduced, and fresh demand began to absorb supply. Santiment’s current reading of -28.5% is notable because it places the average one-year holder in a meaningful unrealized loss position, while the 30-day MVRV near zero indicates short-term traders are no longer sitting on large paper gains. That combination often marks a cleaner base than periods where both cohorts remain heavily in profit.
There is also a supply-side argument. Market commentary aggregated in March 2026 points to roughly 37.5 million ETH staked, which reduces immediately liquid supply, although that figure should be treated as secondary-source reporting here rather than a primary-chain count. If staking remains elevated while ETF products continue to absorb coins on net, the float available for discretionary selling can tighten. That does not guarantee a rally, but it helps explain why valuation recoveries in Ethereum can accelerate once demand returns.
By comparison, short-term MVRV readings near or above local danger zones usually imply traders have enough profit to sell into strength. Santiment’s note that the 30-day MVRV briefly touched +5.6% and then reset matters because it suggests some of that overhead supply has already been worked off. In other words, the market is no longer as stretched on a one-month basis, even though it still looks depressed on a one-year basis.
ℹ️
Why this metric matters:
MVRV does not predict the exact day of a bottom. It measures holder profitability. Deeply negative long-term readings have historically aligned with accumulation zones, but price usually needs a separate catalyst such as stronger ETF demand, improving macro conditions, or rising on-chain activity to sustain a breakout.
3 paths as ETH tests a post-capitulation recovery band
The bullish path is straightforward: ETF inflows stabilize, derivatives leverage stays contained, and Ethereum’s on-chain usage or staking narrative improves enough to pull spot buyers back in. Under that scenario, the negative 365-day MVRV would look like a classic late-correction signal rather than a warning of structural weakness. The historical argument for 130%+ rebounds depends on this sequence.
The neutral path is slower. ETH could remain range-bound while MVRV gradually repairs through time rather than price. That would mean the market spends weeks or months digesting losses, with occasional ETF inflow bursts offset by outflow days and derivatives-led volatility. This is common after sharp corrections because realized cost basis adjusts more slowly than spot price.
The bearish path is that macro risk, weak crypto-wide sentiment, or renewed leverage imbalances push ETH lower before the valuation signal resolves. A negative MVRV reading can get more negative if price falls faster than realized value. That is why analysts usually pair MVRV with liquidity, flows, and positioning rather than using it in isolation.
Frequently Asked Questions
Frequently Asked Questions
What does Ethereum’s MVRV ratio measure?
MVRV compares Ethereum’s market value with realized value, which is a proxy for the aggregate on-chain cost basis of coins. Glassnode describes it as a measure of unrealized profit or loss, and Santiment’s March 2026 data show the 365-day version at -28.5%, meaning many one-year holders remain under water.
Why do traders link this zone to past 130%+ rallies?
The link comes from historical pattern analysis: deep long-term undervaluation has often appeared near major Ethereum accumulation phases. It is not a guarantee. The signal becomes more useful when paired with improving demand indicators such as ETF inflows, stronger spot volume, or healthier derivatives positioning.
Are US spot Ethereum ETFs supporting the recovery?
In aggregate, yes, but the path is uneven. Farside Investors shows cumulative net inflows of about $11.62 billion, yet daily March 2026 flows swung sharply from +$169.4 million on March 4 to -$90.9 million on March 5 and -$51.3 million on March 9 before a +$12.6 million day on March 10.
Does a negative MVRV mean ETH has already bottomed?
No. A negative long-term MVRV suggests undervaluation relative to holder cost basis, not a confirmed bottom. Price can stay below realized value for extended periods if macro conditions worsen or leverage remains elevated. That is why traders also watch funding, open interest, and spot flows.
What should readers watch next?
The most useful checkpoints are whether the 365-day MVRV starts recovering from -28.5%, whether ETF flows remain net positive over multiple sessions, and whether derivatives metrics cool rather than overheat. A stronger recovery usually needs all three to improve together, not just one.
Conclusion
Ethereum’s return to a rare long-term MVRV discount zone is a measurable on-chain event, not just a narrative. As of early March 2026, Santiment’s 365-day MVRV reading of -28.5% shows meaningful holder pain, while ETF data from Farside Investors and derivatives monitoring from CoinGlass show that demand is present but inconsistent. That mix explains why some analysts see the setup as historically constructive while others remain cautious on timing. The metric says Ethereum is cheap relative to many holders’ cost basis. It does not say the rebound must start immediately.
Disclaimer: This article is for informational purposes only and is not financial advice. Crypto assets are highly volatile and losses can include total loss of capital. Readers should verify data independently and consult a qualified financial adviser before making investment decisions.