XRP traded near $1.38 to $1.44 in March 2026 while holding a long-running rising support line visible on higher-time-frame charts, but weakening derivatives participation and repeated failures below overhead resistance are keeping downside risk in focus. CoinGecko, CoinCodex and market data tracked by TradingView all show XRP consolidating after a sharp pullback from earlier highs, leaving traders focused on whether the multi-year structure survives the next volatility test.
XRP Snapshot: Price, Volume and Market Value
| Metric | Latest referenced reading | Source timestamp |
|---|---|---|
| XRP price | About $1.38 to $1.44 in March 2026 | March 10-12, 2026 |
| 24-hour/period volume | About $2.5 billion to $4.17 billion across referenced datasets | March 10-12, 2026 |
| Market capitalization | About $83.3 billion to $85.3 billion | March 10-12, 2026 |
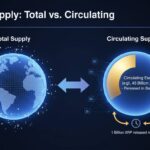
| Circulating supply reference | About 57.24 billion to 61 billion XRP in public trackers | January-March 2026 references |
Source: CoinGecko, CoinLore, CoinCodex, XRP Academy FAQ | accessed from indexed pages in March 2026
$1.20 to $1.60 Range Frames the Next XRP Break
XRP’s immediate technical picture is defined by compression, not trend expansion. Public market trackers show the token spending March 2026 inside a broad $1.20 to $1.60 value area, with closes around $1.38 to $1.43 on March 10-12. CoinLore listed XRP at $1.39 on March 10 with roughly $2.5 billion in volume and an $83.3 billion market cap, while CoinCodex showed a March 10-11 close near $1.38 with $4.17 billion in volume and an $85.29 billion market cap. That places XRP well below the levels seen during stronger momentum phases, but still far above the sub-$1 zone that would signal a deeper structural breakdown.
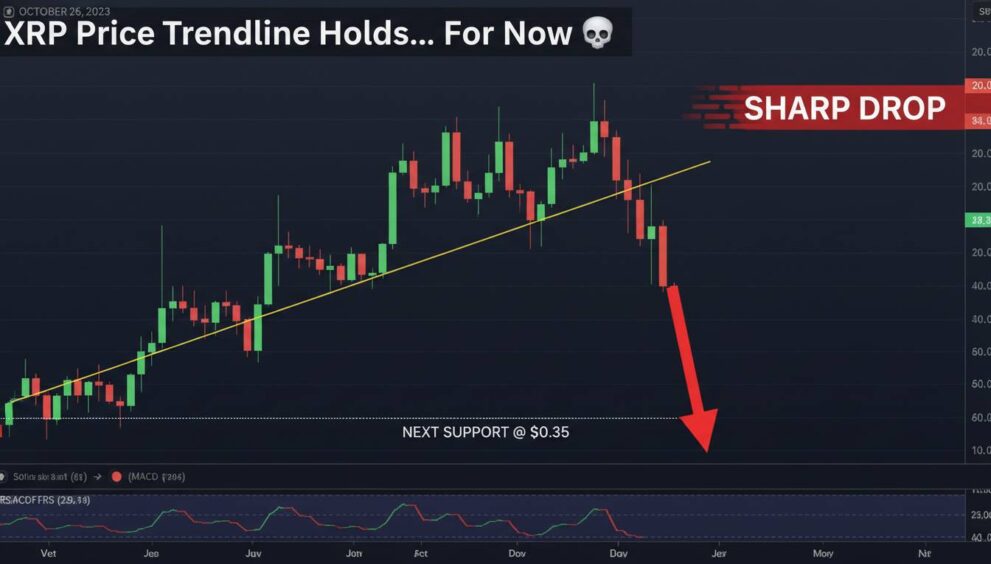
The trendline argument comes from higher-time-frame chart structure. A TradingView-linked market report described XRP as retesting a rising support line that previously aligned with major rallies, including the 2017 cycle and a 2024 advance. That does not confirm another rally, but it explains why chart-focused traders are watching support rather than chasing breakouts. The same report also identified a heavy supply zone around $2.40 to $2.60, meaning XRP would need a weekly close above that band to invalidate the broader ceiling that has capped upside attempts.
That context matters because trendlines are only useful when they coincide with liquidity and participation. If price sits on support while volume fades and leverage unwinds, the support can fail quickly. In XRP’s case, that is the central risk behind the “crash could be looming” thesis: the chart may still be intact, but the market underneath it looks less committed than during prior impulse moves.
⚠️
Support is visible, but conviction is mixed.
TradingView-linked chart analysis places XRP on a multi-year rising trendline, while derivatives and ETF-flow reports cited by market outlets show softer participation in early March 2026. That combination often increases the importance of the next weekly close.
Derivatives Data Shows Why a Breakdown Risk Is Still Real
Leverage data gives the clearest reason to treat the support test cautiously. CoinGlass coverage referenced in market reports showed XRP open interest falling to a 2025 low during an earlier correction, a sign that traders had been reducing leveraged exposure rather than adding aggressively on dips. Separate March 2026 reporting cited open-interest changes of roughly 2.43% higher during a short rebound, but those same reports also described funding rates as jumping sharply from depressed levels while remaining fragile. In practice, that means XRP has seen bursts of speculative interest, but not the kind of sustained derivatives build that usually underpins a durable breakout.
There is also a liquidity issue. One March market report described volume falling nearly 16% while XRP consolidated near $1.3649 and open interest slipped to about $2.30 billion. Even allowing for differences between data vendors, the direction is consistent: participation has thinned as XRP approaches a decision point. Thin participation can amplify both upside and downside, but when price is below major resistance, it tends to make downside air pockets more dangerous.
Historically, XRP has been prone to fast repricing once it leaves a high-volume zone. Reports discussing the March structure pointed to a low-liquidity pocket between roughly $1.00 and $1.20 if the token loses the lower edge of its current range. That does not guarantee a drop into that band, but it identifies where price could move quickly if bids fail to absorb selling pressure.
XRP Timeline: Trendline, Lawsuit and March 2026 Setup
December 2020: The SEC sued Ripple and two executives, alleging unregistered XRP sales worth about $1.3 billion.
March 20, 2025: AP reported XRP jumped after Ripple CEO Brad Garlinghouse said the SEC had dropped its case.
March 10-12, 2026: Public price trackers showed XRP around $1.38 to $1.44 with market cap near $83 billion to $85 billion.
March 2026: TradingView-linked analysis highlighted XRP retesting a multi-year rising trendline while resistance remained concentrated near $2.40 to $2.60.
Why March 2026 Macro and Legal Context Still Matter
XRP is not trading in isolation. The Federal Reserve’s March 2026 meeting concluded on March 18, 2026, with broad market coverage focused on a hold in rates and updated projections. For crypto, a rate hold is not automatically bullish; what matters is whether liquidity-sensitive assets attract fresh risk appetite afterward. So far, XRP’s price action suggests caution rather than broad risk-on follow-through.
Regulation remains another important backdrop. The SEC’s long-running case against Ripple shaped XRP trading for years, and AP reported on March 20, 2025 that Garlinghouse said the agency had dropped the case. Axios separately reported on March 19, 2025 that the SEC would withdraw its appeal, framing the development as the effective end of a major overhang. That legal shift removed one of XRP’s biggest historical headwinds, but by March 2026 the token was still struggling to reclaim higher resistance. The implication is straightforward: legal clarity helped remove a discount, yet it has not by itself created a sustained breakout.
On-chain activity offers a partial counterweight to the bearish case. Market coverage in March 2026 cited XRP Ledger daily transactions reaching 2.7 million, nearly double a cited 180-day high of 1.45 million from January 2026. Other reports pointed to stronger DEX activity and wallet growth on XRPL through late 2025 and early 2026. If that activity persists, it could support the argument that XRP’s network usage is improving even while price consolidates. Still, transaction growth and token price do not always move together over short periods.
Support vs Resistance: XRP’s Main Technical Zones
| Zone | Why it matters | Referenced source |
|---|---|---|
| $1.20 to $1.60 | High-volume area where XRP has consolidated | Market reporting citing chart structure |
| $1.00 to $1.20 | Lower-liquidity pocket if support fails | Market reporting on volume profile |
| $2.40 to $2.60 | Major supply cluster; weekly close above would improve structure | TradingView-linked analysis |
Source: TradingView-linked market report and cited March 2026 chart commentary
3 Paths as XRP Tests a Multi-Year Structure
The first scenario is support holds and XRP continues to base above the rising trendline. For that to gain credibility, traders would likely need to see stronger spot volume and a steadier build in open interest, not just short-lived funding spikes. A recovery through the upper end of the $1.20 to $1.60 range would be the first sign that buyers are regaining control.
The second scenario is continued drift. That would mean XRP remains technically intact on the long-term chart but fails to reclaim enough momentum to challenge the $2.40 to $2.60 supply zone. This is plausible because the token has already shown that legal clarity and bursts of network activity are not enough on their own to force a breakout.
The third scenario is the one implied by the “crash” warning: a decisive break below the current support band triggers a faster move into the lower-liquidity area beneath it. In that case, the multi-year trendline would no longer be the dominant feature; market structure would shift to failed support and trapped longs. That outcome is not confirmed by present data, but it is consistent with fading participation, uneven leverage and repeated rejection below major resistance.
Frequently Asked Questions
Frequently Asked Questions
Is XRP still holding a multi-year trendline in March 2026?
Yes, chart-based market coverage in March 2026 described XRP as retesting a long-term rising support line on higher-time-frame charts. That observation comes from TradingView-linked analysis, but trendlines are interpretive tools rather than official metrics, so traders usually confirm them with price closes and volume.
Why are some analysts warning about a sharp XRP drop?
The warning is tied to weakening participation rather than a confirmed collapse. Reports citing CoinGlass data showed softer open interest and unstable funding conditions, while other market commentary identified a lower-liquidity zone below the current range. If support breaks, price can move faster where fewer bids are stacked.
What price levels matter most for XRP right now?
Referenced March 2026 chart commentary points to $1.20 to $1.60 as the active consolidation area, with $1.00 to $1.20 as a weaker support pocket below. On the upside, a supply cluster around $2.40 to $2.60 is the main resistance band that would need to be cleared on a weekly basis to materially improve structure.
Did the SEC case ending remove XRP’s biggest risk?
It removed a major legal overhang, but not all market risk. AP reported on March 20, 2025 that Ripple’s CEO said the SEC had dropped its case, and Axios reported on March 19, 2025 that the SEC would withdraw its appeal. Even after that shift, XRP still faced macro pressure and technical resistance in 2026.
Does stronger XRP Ledger activity guarantee a higher XRP price?
No. Reports in March 2026 cited XRPL daily transactions reaching 2.7 million and stronger DEX activity, which can support the long-term utility case. But token prices also depend on liquidity, positioning, macro conditions and market sentiment, so network growth does not automatically produce an immediate price breakout.
Conclusion
XRP’s chart still offers bulls a clear argument: the token is holding a multi-year rising structure and remains inside a range that has not yet broken down. But the bearish case is also grounded in data. Spot momentum has been uneven, derivatives participation has looked fragile, and major resistance remains well above the market. For now, the most defensible reading is not that a crash is certain, but that XRP is sitting at a point where a long-watched support line is doing most of the work. If that line fails, the drop could be sharper than the calm surface of the chart suggests.
Disclaimer: This article is for informational purposes only and is not financial advice. Crypto assets are highly volatile and losses can be total. Readers should verify market data independently and consult a qualified financial adviser before making investment decisions.