
Bitcoin’s long-term holder MVRV ratio is still sitting in what on-chain analysts describe as an “opportunity” area, even as BTC trades at $70,831 on March 19, 2026, after falling 4.2% from the prior close, according to market data and Glassnode’s long-term holder framework. The setup matters because MVRV compares market value with realized value, offering a way to gauge whether long-term coins are carrying stretched profits or are still in a historically less euphoric phase.
Bitcoin Market Snapshot
$70,831
Down 4.2% from previous close
$70,560 to $74,272
High-volatility session
About 20 million BTC
Final million era
Sources: market data tool, CoinGecko, Coinbase, March 2026
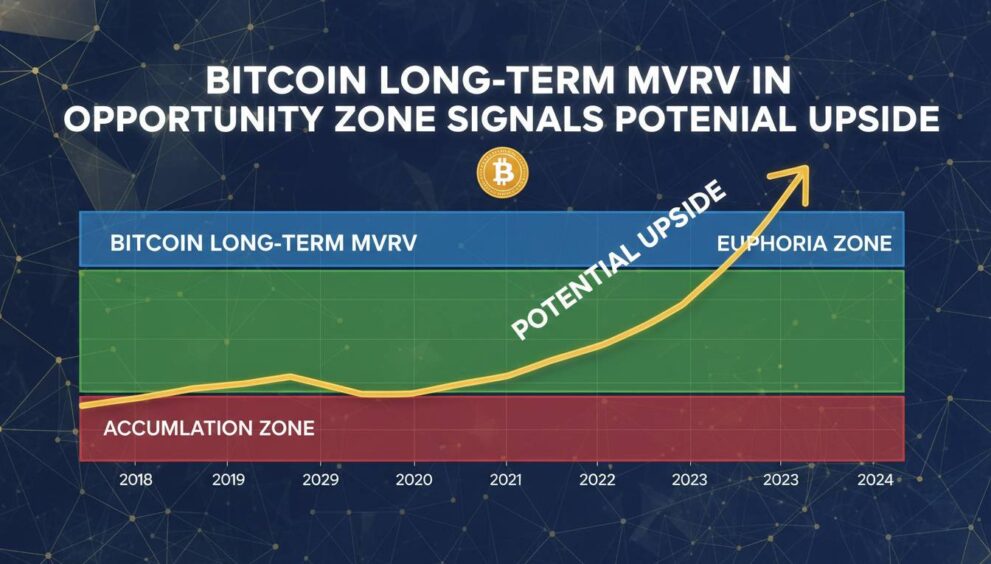
How the 155-day long-term holder MVRV frame defines an opportunity zone
Glassnode defines long-term holders as wallets holding coins for at least 155 days. Its long-term holder MVRV ratio measures the relationship between Bitcoin’s market value and the realized value of coins held by that cohort. In plain terms, it estimates whether older coins are sitting on modest gains, deep losses, or overheated profits. That makes it different from spot price alone. Price tells traders where Bitcoin changes hands now; long-term holder MVRV shows how much embedded profit older holders carry relative to their cost basis.
The “opportunity zone” language usually refers to periods when the ratio is low enough that long-term holders are not in extreme profit-taking territory. That does not guarantee an immediate rally. It does, however, indicate that the market is not yet in the kind of late-cycle condition that historically encouraged broad distribution from seasoned holders. Glassnode’s public chart description states that long-term holder MVRV is an oscillator measuring the average unrealized profit or loss multiple held by Bitcoin long-term holders, using the 155-day threshold as the cohort boundary.
That distinction matters in March 2026 because Bitcoin is trading well below the 2025 all-time high of $126,210.50 cited by Coinbase market data, while still far above the structural floor area around realized price that Glassnode-linked market commentary placed near $55,000 in February 2026. In other words, BTC is no longer in the euphoric zone seen near cycle peaks, but it is also not trading at the kind of distressed levels associated with deep bear-market capitulation.
Why MVRV matters more than price alone
MVRV adds cost-basis context. A $70,000 Bitcoin can be expensive or cheap depending on where long-term holders acquired their coins and how much unrealized profit they already hold.
That is why the metric is widely used in cycle analysis. A high MVRV reading suggests holders are sitting on large paper gains and may be more likely to sell into strength. A lower reading suggests profit-taking pressure may be less intense because the cohort is not yet deeply in the money. For long-horizon investors, that framework is often more useful than short-term momentum alone.
Bitcoin at $70,831 sits between realized-price support and the 2025 peak
Bitcoin’s current market structure helps explain why the long-term holder MVRV signal is attracting attention. BTC is at $70,831 on March 19, 2026, with an intraday low of $70,560 and high of $74,272. Coinbase market data cited in March 2026 places Bitcoin’s market cap around $1.34 trillion when BTC traded near $66,684, while CoinGecko’s tokenomics page shows a market cap above $1.34 trillion with circulating supply around 20 million BTC. Those figures confirm that Bitcoin remains the dominant crypto asset by market value even after a sharp pullback from 2025 highs.
The historical anchor is important. Coinbase lists Bitcoin’s all-time high at $126,210.50 on October 6, 2025. That means the current price is roughly 44% below that peak. At the same time, Glassnode-linked reporting in February 2026 described realized price near $55,000 and a broader realized market value support band extending toward the upper-$70,000 area. This places the current market in a middle regime: above structural cost-basis support, below prior speculative extremes.
Bitcoin’s March 2026 Position in Context
| Metric | Reading | Context |
|---|---|---|
| BTC Price | $70,831 | March 19, 2026 market reading |
| 2025 All-Time High | $126,210.50 | Reached October 6, 2025 |
| Realized Price | About $55,000 | Structural floor area cited in February 2026 |
| Circulating Supply | About 20 million BTC | More than 95% of total supply issued |
Sources: market data tool, Coinbase, CoinGecko, Glassnode-linked reporting | March 2026
That middle regime is exactly where long-term holder MVRV becomes useful. If the ratio were stretched, the market would be signaling that older holders had accumulated enough unrealized profit to create heavier sell pressure. If the ratio were depressed near capitulation levels, the market would be signaling broad pain. Instead, the “opportunity zone” framing suggests a less crowded profit profile among long-term holders than at prior tops.
Separately, public Bitcoin community trackers in March 2026 noted that more than 95% of total supply is already in circulation and that over 4 million BTC are held by companies, governments, DeFi systems, and ETFs. Those figures are not direct MVRV inputs, but they reinforce the broader supply-tightness narrative around Bitcoin’s mature issuance schedule and increasingly institutionalized ownership base.
Why lower long-term holder profitability can reduce distribution pressure
The mechanism behind the signal is straightforward. When long-term holders carry very large unrealized gains, they have more incentive to distribute coins into strength. That selling can cap rallies or trigger broader corrections. When their unrealized gains are more moderate, the urgency to sell tends to be lower. In that environment, fresh demand can have a larger effect on price because fewer older coins are being released back into the market.
Glassnode’s broader 2025 and 2026 commentary supports that interpretation. In April 2025, the firm noted that monitoring MVRV together with realized profit-taking behavior could help determine whether Bitcoin was rebuilding a constructive recovery after a correction. In March 2026, social and media references to Glassnode data also pointed to cooling long-term holder sell-side risk, suggesting that older holders were still net sellers but at a lower rate than in prior heavy-distribution periods.
This does not mean long-term holders have stopped selling. It means the intensity appears lower than in overheated phases. That distinction is critical. Bitcoin bull markets often continue only when new demand can absorb coins released by profitable holders. If the long-term holder MVRV ratio stays in a lower band, the market may face less resistance from entrenched profit-taking than it did near the 2025 peak.
Key Bitcoin Context for the Current MVRV Reading
Coinbase market data places the cycle peak at $126,210.50, a level associated with much richer holder profitability.
Glassnode-linked market commentary identifies realized price near $55,000 and a broader support structure below the prior highs.
Bitcoin remains above realized-price support but far below the 2025 top, keeping long-term holder profitability below euphoric extremes.
By comparison, short-term holder stress has at times been more visible than long-term holder stress in this cycle. In April 2025, CoinDesk reported that short-term holder MVRV fell to 0.82, a level associated with market stress, while long-term holders had increased their cohort supply by roughly 500,000 BTC since February. That divergence matters because it suggests weak hands were pressured while stronger hands continued to absorb supply.
What the historical MVRV pattern says about upside without calling a top
MVRV is most useful as a regime indicator, not a precise timing tool. Historically, Bitcoin’s broad MVRV framework has helped identify periods when the asset was deeply undervalued relative to aggregate cost basis and periods when it was significantly overheated. Public CryptoQuant commentary cited in late 2025 placed a broader Bitcoin MVRV bottom range around 1.8 to 2.0, while Glassnode’s long-term holder version focuses specifically on the older-coin cohort rather than the full market.
The practical takeaway is narrower than many headlines suggest. An “opportunity zone” does not mean Bitcoin must rally immediately, and it does not imply a guaranteed return to the 2025 high. What it does indicate is that the market may still be in a phase where long-term holder profitability is not stretched enough to resemble classic late-cycle excess. That can leave room for upside if demand improves, macro conditions stabilize, or ETF and treasury accumulation resumes at scale.
There is also a historical pattern in how Bitcoin transitions between these regimes. Early recoveries often begin when short-term holders are under pressure, long-term holders absorb supply, and realized-profit metrics cool. Later in the cycle, MVRV expands as price outruns aggregate cost basis. Eventually, that expansion creates the conditions for heavier profit-taking. The present setup appears closer to the middle of that sequence than the end of it.
What the signal does not say
The long-term holder MVRV ratio does not forecast a date, a target price, or a guaranteed breakout. It only shows that older holders are not yet in the kind of extreme profit regime often seen near major tops.
That is why context matters. Bitcoin is still exposed to macro liquidity, ETF flow shifts, derivatives positioning, and regulatory headlines. A favorable MVRV reading can coexist with short-term volatility. On March 19, 2026, for example, BTC still posted a sharp daily decline despite the broader on-chain argument that long-term holder profitability is not overheated.
March 2026 data show a market that is mature, liquid, and still supply constrained
Several March 2026 data points reinforce the idea that Bitcoin’s market is structurally different from earlier cycles. CoinGecko’s market data shows circulating supply near 20 million BTC, while community trackers place the share of issued supply above 95%. That means new issuance is no longer the dominant variable it once was. Instead, market behavior is increasingly shaped by who holds existing coins, at what cost basis, and with what willingness to sell.
Ownership concentration across institutional channels also matters. Public trackers in March 2026 estimated that more than 4 million BTC were held by companies, governments, DeFi systems, and ETFs, representing roughly one-fifth of circulating supply. Even allowing for methodological differences across trackers, the direction is clear: a meaningful share of Bitcoin supply is now parked in vehicles or balance sheets that may not trade with the same frequency as retail spot accounts.
That makes long-term holder metrics more relevant, not less. In a market where a large portion of supply is tightly held, changes in unrealized profitability among patient holders can have an outsized effect on available float. If those holders are not under pressure to distribute, then marginal demand can move price more quickly. If they are deeply in profit and begin selling aggressively, rallies can stall.
By comparison with prior cycle extremes, today’s setup still looks restrained. Bitcoin’s market cap remains enormous, but price is still far from the October 2025 record. Realized-price support remains materially lower than spot, suggesting the average on-chain cost basis is still below the market. That spread is constructive, but not euphoric. It is one reason the “opportunity zone” label continues to circulate in on-chain analysis.
What traders and long-term investors can actually take from the signal
For traders, the main value of long-term holder MVRV is filtering noise. A single red day does not invalidate a constructive on-chain backdrop, just as a single green day does not confirm a new bull leg. The metric is better used to identify whether Bitcoin is trading in a zone historically associated with accumulation, neutral expansion, or overheated distribution.
For long-term investors, the signal offers a way to frame risk. If long-term holder MVRV is still in an opportunity area, the market may not yet be pricing in the kind of extreme embedded profits that often precede major tops. That does not remove downside risk. It simply suggests that the structural conditions are different from a late-stage blowoff where older holders are sitting on outsized gains and rushing to sell.
There are still clear limits. MVRV does not capture derivatives leverage directly. It does not measure ETF flow momentum in real time. It does not account for macro shocks, policy changes, or sudden liquidity events. It is one tool, albeit a useful one, for understanding where Bitcoin sits relative to its own on-chain history.
The strongest reading of the current data is modest but important: Bitcoin’s long-term holder cohort does not appear to be in a fully euphoric profit regime at today’s price. With BTC at $70,831 on March 19, 2026, above realized-price support but well below the 2025 peak, that leaves room for upside if demand strengthens. It does not settle the next move. It does clarify the market’s starting point.
Conclusion
Bitcoin’s long-term holder MVRV ratio remains relevant because it measures something spot price cannot: how much unrealized profit older holders are carrying relative to their cost basis. In March 2026, that signal still points to a market that is not deeply distressed but also not obviously overheated. BTC is trading far below its October 6, 2025 all-time high of $126,210.50 and above the realized-price area near $55,000 cited in February 2026 commentary. That combination supports the view that Bitcoin is in a middle-cycle valuation zone where upside is still possible, especially if demand improves and long-term holders continue to limit distribution.
Frequently Asked Questions
What is Bitcoin’s price right now?
Bitcoin is trading at $70,831 as of March 19, 2026, according to the market data tool used for this report. The session range is $70,560 to $74,272, showing that volatility remains elevated even while on-chain valuation metrics point to a less overheated long-term holder backdrop.
What does long-term holder MVRV mean?
Long-term holder MVRV is a Glassnode metric that compares Bitcoin’s market value with the realized value of coins held by investors who have kept their BTC for at least 155 days. It helps show whether older holders are sitting on modest gains, heavy losses, or stretched profits at a given time.
Why is the “opportunity zone” important for Bitcoin?
The phrase suggests long-term holders are not yet in an extreme profit regime that historically encouraged aggressive selling. In March 2026, that matters because Bitcoin is well below the October 6, 2025 all-time high of $126,210.50 while still above the realized-price area near $55,000 cited in February 2026 market commentary.
Does an opportunity-zone MVRV reading guarantee Bitcoin will rise?
No. The metric does not guarantee a rally or provide a date-specific forecast. It only indicates that long-term holder profitability is not at the kind of extreme level often seen near major cycle tops. Bitcoin can still fall if macro conditions, flows, or leverage turn negative.
How does today’s Bitcoin price compare with the 2025 peak?
At $70,831 on March 19, 2026, Bitcoin is roughly 44% below the all-time high of $126,210.50 recorded on October 6, 2025, based on Coinbase market data. That gap is one reason on-chain analysts do not classify the current market as a fully euphoric late-cycle environment.
Disclaimer: This article is for informational purposes only and is not investment advice. Cryptocurrency markets are volatile, and past market behavior or on-chain patterns do not guarantee future results. Readers should verify data independently and assess risk before making financial decisions.